Published
Chasing the Green: How I Hit a Perfect 100/100 on PageSpeed Insights
By Frederick Socorin · Updated
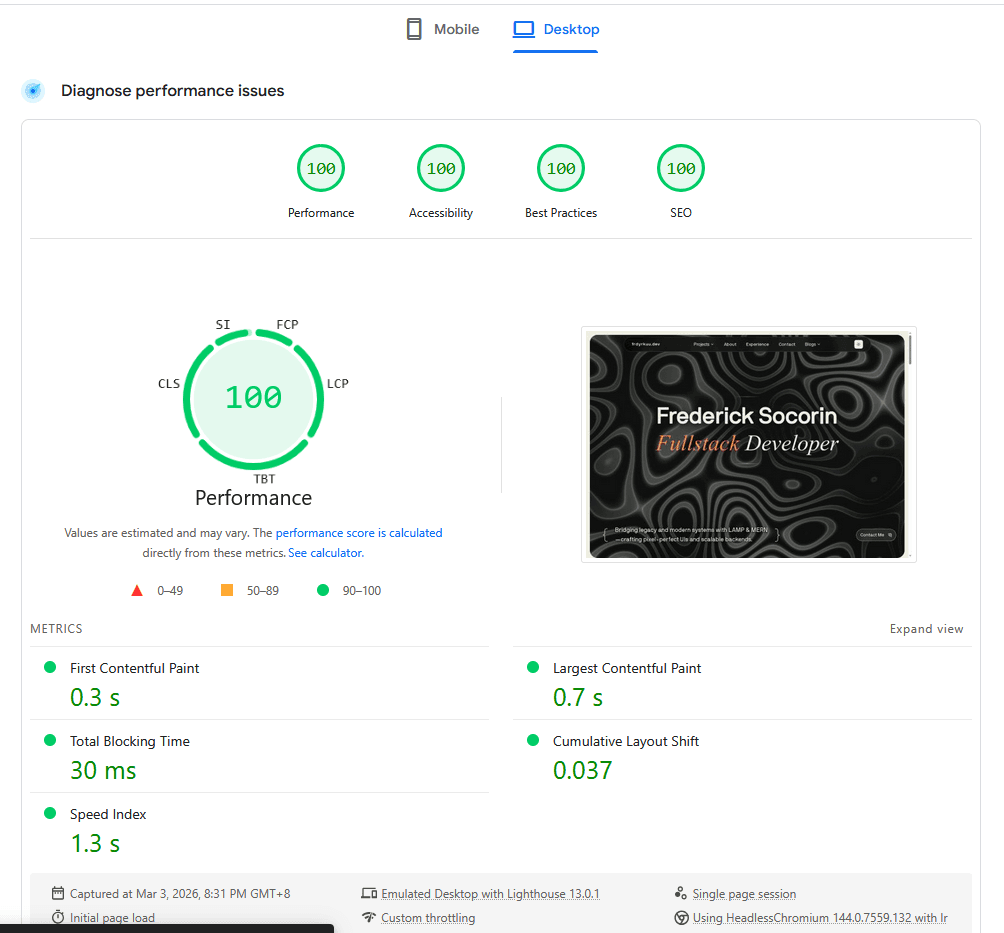
If you’re a developer, you probably know the absolute thrill of running a Lighthouse audit and seeing nothing but a wall of green. I recently put my full-stack developer portfolio, frdyrkuu.dev, to the test on PageSpeed Insights, and I honestly couldn’t be happier with the results.
Here is a breakdown of my report and what these numbers actually mean for my site’s user experience.
The Perfect Sweep
Hitting a clean sweep of 100s across Performance, Accessibility, Best Practices, and SEO was the ultimate goal. It proves that a site isn’t just fast, but it’s also built with inclusive design, modern web standards, and search engine visibility in mind.

The Scoreboard
A perfect score isn’t just a vanity metric; it’s a sign of a healthy, user-first experience.
- Performance (100): My site is lightning fast, with a 0.3s First Contentful Paint.
- Accessibility (100): It’s built for everyone, ensuring screen readers and keyboard navigation work flawlessly.
- Best Practices (100): I’ve adhered to modern web standards, from HTTPS to secure cross-origin links.
- SEO (100): Search engines can easily crawl and index my content.
My Core Web Vitals Breakdown
The performance score is driven by Core Web Vitals. Getting to 100 meant optimizing these specific metrics to the absolute limit:
- First Contentful Paint (FCP) at 0.3 s: This is lightning fast. I made sure that the moment someone clicks a link to my site, the browser starts rendering content almost instantly so nobody is staring at a blank screen.
- Largest Contentful Paint (LCP) at 0.7 s: The hero section and the largest text blocks on my portfolio load in well under a second. It gives the immediate impression that the site is fully loaded and ready to go.
- Speed Index at 1.3 s: The visual parts of my page populate incredibly quickly, making the whole loading experience feel seamless.
- Total Blocking Time (TBT) at 30 ms: I kept my JavaScript execution tight. With a TBT of just 30 milliseconds, the main thread is mostly free, meaning users can scroll or click without the site freezing up on them.
- Cumulative Layout Shift (CLS) at 0.037: Nobody likes reading a page only for the text to suddenly jump down because an image finally loaded. I made sure to define my dimensions so that my layout stays rock solid from the first millisecond to the last.
Why It Matters
In a world where users bounce if a page takes more than 3 seconds to load, performance is a feature. Building frdyrkuu.dev was about more than just showing off my projects—it was about proving that I can build high-performance, accessible, and scalable web applications.
The Takeaway
Building frdyrkuu.dev was a massive learning experience in prioritizing the end-user. Getting these perfect scores takes a lot of fine-tuning under the hood, but seeing that 100/100 across the board makes the late-night debugging entirely worth it.